
Modern applications nowadays have a distributed architecture that is composed of multiple components, sub-systems, and data sources. This poses a challenge in monitoring each component of your multi-tier application. You have to check your database, your application server, your Content Delivery Network (CDN), your storage systems, and other modules one by one. These services may have their dashboard where you can observe key system metrics like CPU Utilization, slow DB queries, high latency, and so much more. The problem here is that these dashboards are usually not connected and don’t provide advanced insights that can provide immense value to your business. You have to frantically check each individual dashboard and analyze them manually just to make sense of your raw data.
“Observability” — What’s this, really?
The challenge of getting useful insights from your metrics, logs and monitoring data is where the concept of Observability comes in. The term “Observability” is simply based on control systems engineering, where it was defined as a measurement of how well a system’s internal states could be inferred from its external outputs. In essence, Observability is the ability of your system to provide meaningful insights that affect its underlying components and end users. It provides actionable insights that you can implement to improve your system’s overall performance.
Keep in mind that Observability is not just the mere act of monitoring your systems. Observability requires you to gather relevant data from all system modules and dependencies and develop pertinent insights that can benefit your business overall.
Your cloud architecture in AWS, Azure, or GCP can have a thing called an “Observability stack,” which is composed of services that collect all relevant data from various sources and generate recommendations that you can implement to improve the parts of your application suite. It can also give business insights to increase sales, boost productivity, and save on costs. AWS has different observability tools that you can use and integrate with the other components of your architecture. You can use Amazon Managed Service for Prometheus, Amazon CloudWatch, Amazon OpenSearch Service, Amazon Managed Grafana, and many more.
Observability in AWS with Amazon Managed Grafana
Let us take a look at the Amazon Managed Grafana service and learn its various features and capabilities.
Amazon Managed Grafana is a fully managed service for Grafana. Grafana is an open-source analytics platform that is commonly used to query, visualize, observe, and make use of your system data that are gathered from multiple sources. When you hear the phrase “Amazon Managed,” that means AWS is managing the underlying infrastructure required to run an open-source program or a particular tool. For Amazon Managed Grafana, AWS is the one that provisions and manages the required resources to run your Grafana dashboards, along with its other dependencies.
Let’s take a good look at what Grafana really is….
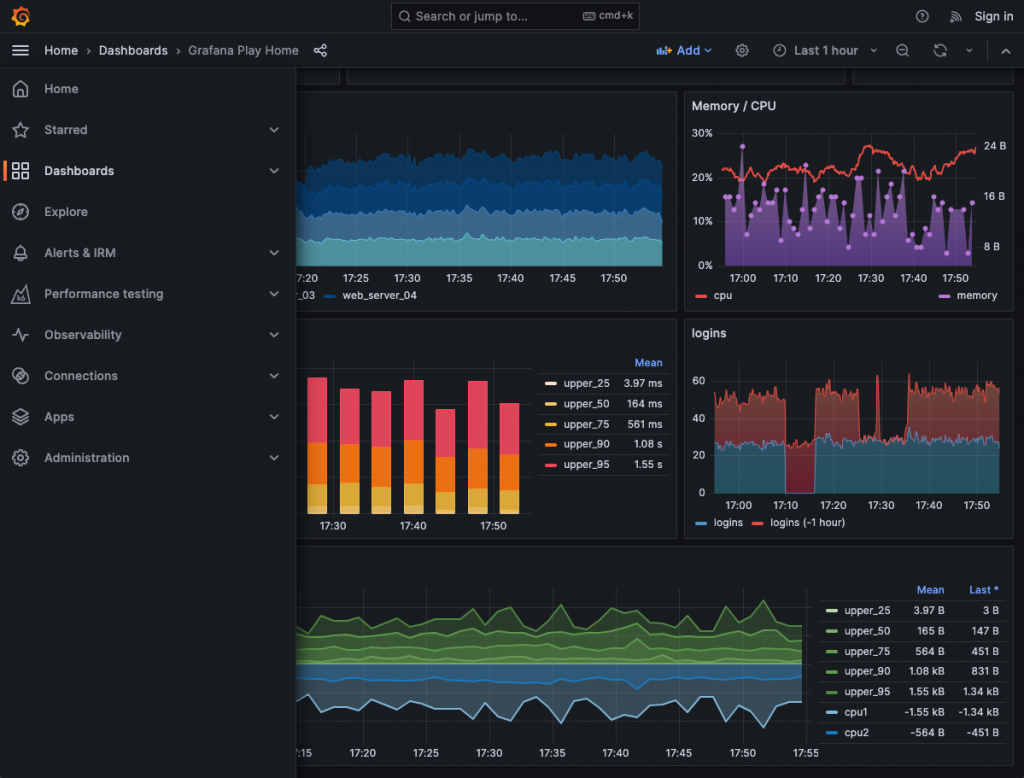
What you see here is an actual Grafana platform. It has tables, graphs, time series data, maps, statistics, and a range of other useful metrics. On its sidebar menu, you’ll see the Dashboards, Explorer, Alert, Grafana Machine Learning, Kubernetes Monitoring, Synthetic Monitoring, and so much more. Grafana can collect metrics from different data sources, so you can have a single place for all your data. In this way, all the metrics from your databases, servers, storage systems, APIs, custom data, logs, and other sources can be aggregated in one location.
This is also the case in Amazon Managed Grafana.
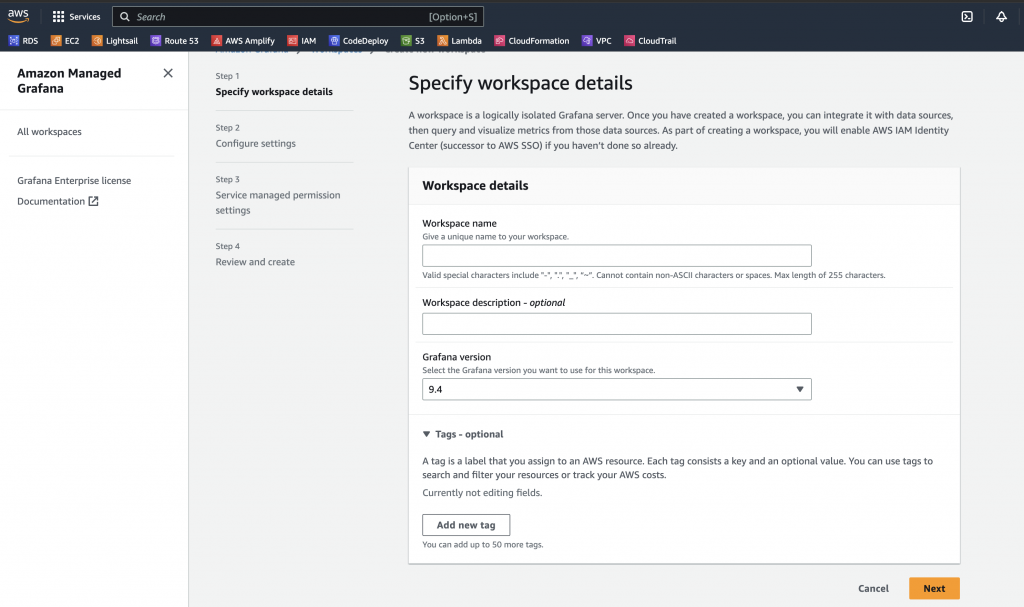
In AWS, Amazon Managed Grafana can collect system metrics from multiple data sources in your observability stack, such as Amazon Managed Service for Prometheus, Amazon CloudWatch, and Amazon Elasticsearch Service. System alerts can also be automated by using different notification services in AWS. You can also integrate this with third-party vendors like Datadog, Splunk, et cetera. In addition, you can set up your own self-managed data source like InfluxDB and integrate it with your Grafana workspace. You also don’t have to worry about the infrastructure required to run your Grafana visualizations and dashboards since the necessary resources are all provisioned and managed by AWS itself.
Amazon Managed Grafana is similar to Amazon CloudWatch Dashboard since both of them have a dashboard where you can see your system metrics. However, Grafana has a much better user interface and can integrate easily with various other systems and data providers.
To learn more about Amazon Managed Grafana, you can checkout the official AWS Documentation below:
https://docs.aws.amazon.com/grafana/latest/userguide/what-is-Amazon-Managed-Service-Grafana.html
Leave a Reply